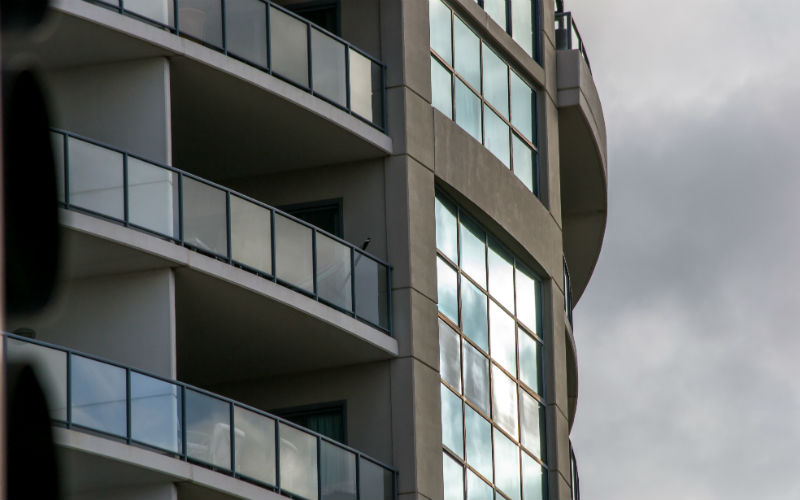
According to the Real Estate Institute of Queensland’s (REIQ) quarterly median sales report, median house prices rose 3.61%, while median unit prices increased by a modest 1.59%.
REIQ CEO Antonia Mercorella said an ease in Queensland’s booming property market was long overdue, following an incredible growth the past year.
“This quarter we’re still seeing healthy growth in most major markets, but at a more sustainable level, as Queensland’s property market appears to finally have caught up on the growth it was well overdue for,” Ms Mercorella said.
“What this means on the ground is that the property buying frenzy has relaxed, allowing a slower more considered approach from buyers which is evidenced by longer days on market.
“It’s good to see some sense of calm returning to the market, taking buying activity from madness to measured, where both agents and buyers can take a breath.”
AMP Chief Economist Shane Oliver expects Brisbane to record a 15% or so decline in property prices, assuming the cash rate tops out around 2.6% early next year.
However, if the cash rate goes to 3.5%, this could push a larger fall.
How have houses performed?
The Brisbane local government area (LGA) median house price remained relatively steady, experiencing a slight decrease to $1,075,000 over the June quarter ($1,090,000 in March quarter).
Meanwhile, the Greater Brisbane region recorded growth of 1.79% over the quarter to $766,000.
The report found Ipswich to be the most affordable LGA in Greater Brisbane, with a median house price of $530,750.
The Fraser Coast LGA and Cairns LGA also continued to have a rising housing market this quarter with 2.67% and 0.93% respectively.
However, the state’s popular tourism centres including the Sunshine Coast and Gold Coast both posted dips in median house price sales compared to last quarter.
The Sunny Coast recorded a -1.52% decrease while the Gold Coast experienced a slight fluctuation of -0.51%.
Are unit prices following the same trend?
Units followed a similar pattern to the house sales market in the June quarter.
The Gold Coast, Sunshine Coast, and Noosa all experienced dips over the quarter with -1.86%, -1.22%, and -10.20% respectively.
Despite this, all three markets had excellent growth of over 20% over the past 12 months.
In Queensland’s regional areas, all areas posted a falling in unit median prices with Rockhampton LGA, -16.03%; Cairns LGA, -14.04%; Gladstone LGA, -12.66%; and Townsville LGA, 10.34%.
The report did note that these regions tend to bounce up and down due to the smaller volume of unit sales.
On the opposite side of the coin, median unit prices were on the rise in Ipswich LGA and Logan LGA, achieving a high quarterly growth of 8.31% and 8.20% respectively.
Advertisement
Buying a home or looking to refinance? The table below features home loans with some of the lowest interest rates on the market for owner occupiers.
| Lender | Home Loan | Interest Rate | Comparison Rate* | Monthly Repayment | Repayment type | Rate Type | Offset | Redraw | Ongoing Fees | Upfront Fees | Max LVR | Lump Sum Repayment | Extra Repayments | Split Loan Option | Tags | Features | Link | Compare | Promoted Product | Disclosure |
|---|---|---|---|---|---|---|---|---|---|---|---|---|---|---|---|---|---|---|---|---|
5.54% p.a. | 5.58% p.a. | $2,852 | Principal & Interest | Variable | $0 | $530 | 90% |
| Promoted | Disclosure | ||||||||||
5.49% p.a. | 5.40% p.a. | $2,836 | Principal & Interest | Variable | $0 | $0 | 80% |
| Promoted | Disclosure | ||||||||||
5.64% p.a. | 5.89% p.a. | $2,883 | Principal & Interest | Variable | $250 | $250 | 60% |
| Promoted | Disclosure | ||||||||||
5.64% p.a. | 5.89% p.a. | $2,883 | Principal & Interest | Variable | $248 | $350 | 60% |
| Disclosure |
Image by Valeriia Miller via Pexels

Ready, Set, Buy!
Learn everything you need to know about buying property – from choosing the right property and home loan, to the purchasing process, tips to save money and more!
With bonus Q&A sheet and Crossword!


 Harry O'Sullivan
 Emma Duffy
