According to CoreLogic's latest data, the May rise was stronger than the 1.8% spike seen in April but weaker than the 32-year high recorded in March when values surged 2.8%.
For the second time in three months, growth in the capital cities outpaced their regional counterparts.
The combined capital city index rose 2.3% in May compared with a 2.0% rise across the combined regional areas.
Buying a home or looking to refinance? The table below features home loans with some of the lowest variable interest rates on the market for owner occupiers.
| Lender | Home Loan | Interest Rate | Comparison Rate* | Monthly Repayment | Repayment type | Rate Type | Offset | Redraw | Ongoing Fees | Upfront Fees | Max LVR | Lump Sum Repayment | Additional Repayments | Split Loan Option | Tags | Row Tags | Features | Link | Compare | Promoted Product | Disclosure |
|---|---|---|---|---|---|---|---|---|---|---|---|---|---|---|---|---|---|---|---|---|---|
5.69% p.a. | 5.70% p.a. | $2,899 | Principal & Interest | Variable | $0 | $0 | 60% |
| Promoted | Disclosure | |||||||||||
5.79% p.a. | 5.83% p.a. | $2,931 | Principal & Interest | Variable | $0 | $530 | 90% |
| Promoted | Disclosure | |||||||||||
5.74% p.a. | 5.65% p.a. | $2,915 | Principal & Interest | Variable | $0 | $0 | 80% |
| Promoted | Disclosure | |||||||||||
5.84% p.a. | 6.08% p.a. | $2,947 | Principal & Interest | Variable | $250 | $250 | 60% |
| Promoted | Disclosure |


")
CoreLogic's research director Tim Lawless said growth conditions remained broad based both geographically and across the housing types and valuations.
“Values were up by more than 1% across every capital city over the month, with both house and unit values lifting across the board," Mr Lawless said.
"Of the 334 SA3 subregions analysed by CoreLogic, 97% have recorded a lift in housing values over the past three months.
"Such a synchronised upswing is an absolute rarity across Australia’s diverse array of housing markets.”
Across the capitals, Hobart was the strongest performer with a 3.2% jump, while Perth saw the weakest growth at 1.1%.
In the regions, regional New South Wales (NSW) led the way with a 2.5% spike, while values in Western Australia regressed 0.1%.
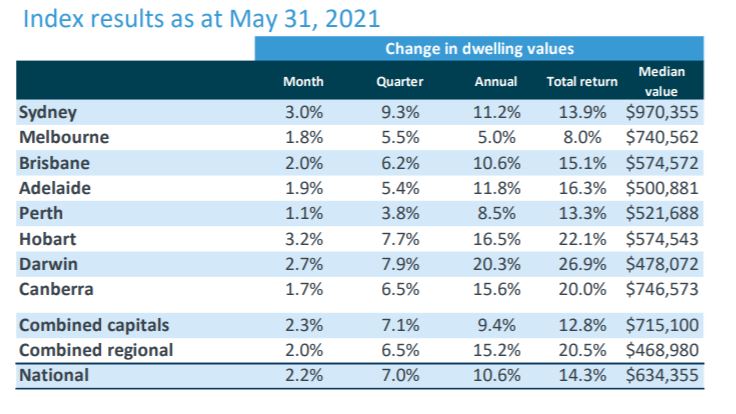
Source: CoreLogic
Mr Lawless said favourable economic conditions, low interest rates and strong consumer confidence were continuing to create demand for housing at a time when demand was far outstripping supply.
However, he noted despite the consistently strong headline result, the underlying trends had shifted over the last year.
“The most expensive end of the market is now driving the highest rate of price appreciation across most of the capital cities, whereas early in the growth cycle it was the most affordable end of the market that was the strongest," he said.
“From a geographic perspective, it was the smaller capital cities that led the housing market out of the COVID slump, but now Sydney has risen through the ranks to record the largest capital gain over the past three months with values up 9.3%.”
Affordability set to worsen as RBA monitors market
CoreLogic said they expected values to rise throughout this year and next, albeit at a slower pace.
"A slowdown in dwelling price appreciation is expected as affordability constraints progressively impact market participation, and potentially tighter credit policies looms further down the track," Mr Lawless said.
"Messaging from the RBA has indicated they will be watching for any signs of a deterioration in credit standards that could be a trigger for tighter lending rules."
CoreLogic said worsening affordability pressures were likely to impact first home buyers more than other segments of the market, with signs activity from the group is already lessening.
Investors are stepping up their activity across the market, which may account for the continued strength across the board, despite affordability constraints.
CoreLogic noted the reduction in Federal Government fiscal support had little to no impact on housing demand or growth in home values to date.
Rental conditions remain mostly positive
Growth conditions had eased a little over recent months but remained strong, with CoreLogic noting the first quarter of the year was seasonally strong for rental markets.
The monthly increase in capital city dwelling rents eased from an average of 1.0% over the March quarter to 0.6% over the past two months.
Similarly, the rate of growth in rents across the combined regional areas of Australia eased back from an average of 1.4% in the March quarter to 1.0% through April and May.
Sydney and Melbourne continued to have the weakest rental conditions, especially across the unit sector where international border closures have had a more significant impact on demand.
Sydney unit rents are 1.8% higher in the past three months but remain 7.5% below their 2018 high, while Melbourne unit rents are down 0.4% in the past three months and 8.5% below their 2019 peak.
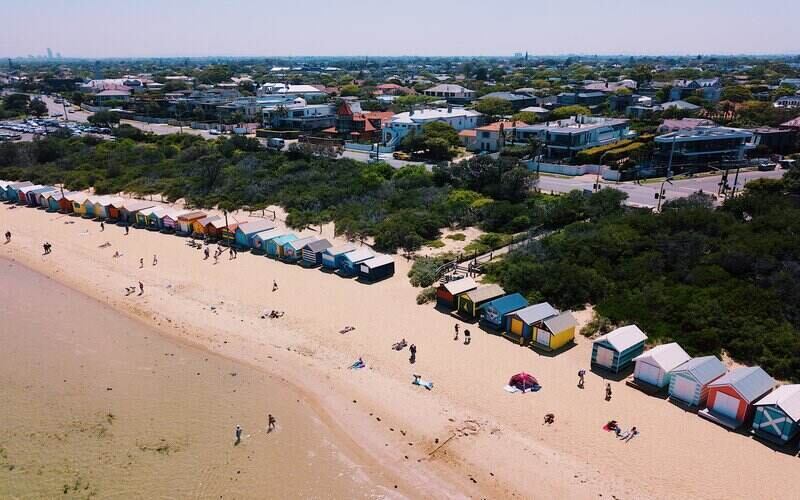
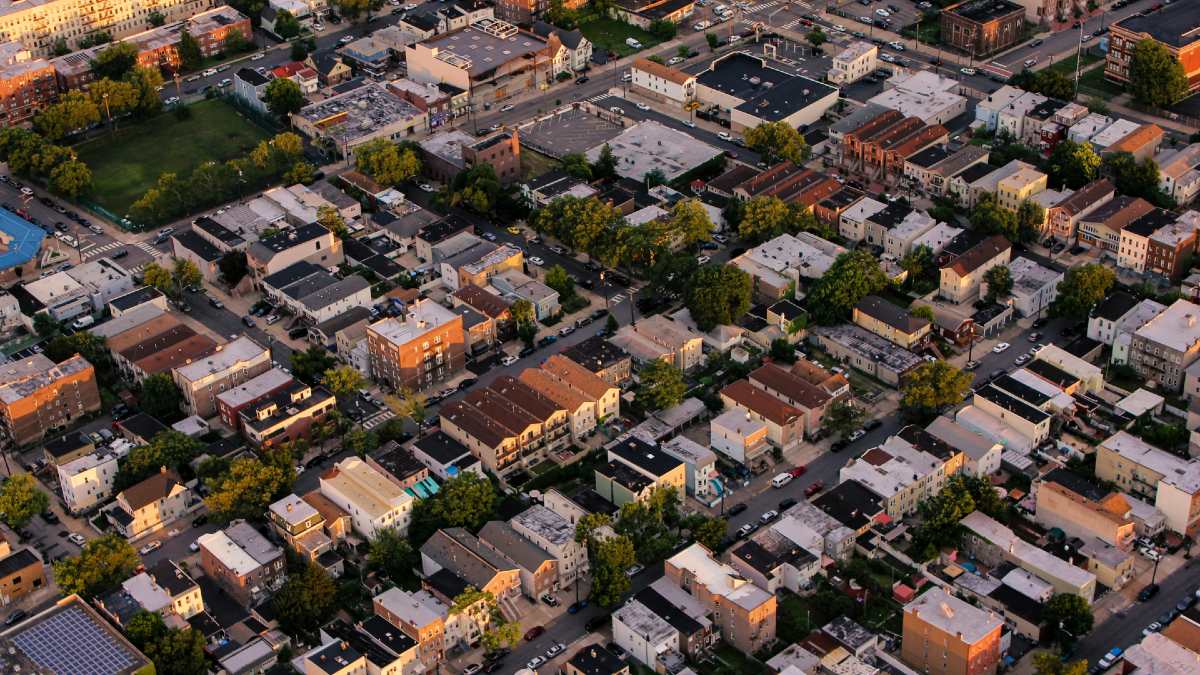
Photo by Titus Aparici on Unsplash

Ready, Set, Buy!
Learn everything you need to know about buying property – from choosing the right property and home loan, to the purchasing process, tips to save money and more!
With bonus Q&A sheet and Crossword!

 Denise Raward
 Bernadette Lunas
 Jacob Cocciolone
 Rachel Horan