CoreLogic’s Pain and Gain Report for the September quarter revealed the median home sale loss widened to $40,000 compared to $33,500 in the June quarter.
The proportion of profitable sales fell to 93.3% of the national total, down from 93.9% in June and from 94.2% in the three months to May.
This equalled a combined resale profit of $26 billion, down from the revised $30.4 billion profit in the June quarter.
CoreLogic Head of Research Eliza Owen said profitability declined as a result of consecutive interest rate rises since May.
“A rise in interest rates creates a double whammy for homeowners, in that the cost of debt becomes harder to service, and the underlying asset value against which the debt is held declines,” Ms Owen said.
The decline in profit making sales also coincided with the recent market downturn, as Australian dwelling values fell 4.8% from the April 2022 peak to the end of September.
House values have since fallen a further 2.2% to the end of November.
The report found there were more loss-making sales in areas where there had been less growth in value over a long period of time, such as resource-town dwellings and investor-grade inner-city apartments.
However, Ms Owen noted there was no widespread distress in these markets either.
“This analysis has not shown any signs of a material increase in distressed sales,” she said.
“While it’s true the recent decline in home values increases the chances of vendors selling at a loss, even properties held for less than two years had a median resale gain of $121,000 in the quarter.”
Which regions posted the highest loss-making sales?
Perth recorded the most loss-making sales, accounting for 21% of the national total in the analysis of 83,000 resales.
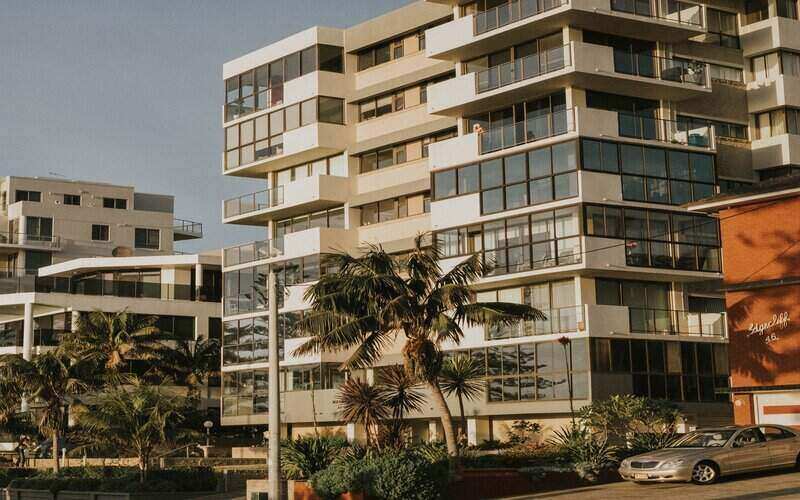
While Perth led the pack in terms of overall unprofitable sales, Sydney took the crown for apartments.
More than one quarter of all loss-making unit resales occurred in the NSW capital.
The council regions of Parramatta, Sydney, and Canterbury-Bankstown posted the highest volume of loss-making sales.
“It is likely that Sydney unit resales have seen a high incidence of loss because of relatively subdued growth cycles through the COVID-19 period,” Ms Owen said.
In Melbourne, loss-making sales were largely concentrated in the unit segment, where 15.7% of resales made a nominal loss compared to just 1.1% of house resales.
The highest volume of loss-making sales were in the Melbourne (39%), Stonnington (27.8%) and Port Phillip (19.3%) council regions.
Compared with Sydney and Melbourne, profitability across the Brisbane housing market remained resilient through the September quarter.
The Brisbane housing market saw 95.6% of resales make a nominal gain in the quarter, unchanged from the three months to June.
Looking to take advantage of falling property prices in 2023 and achieve your new home dreams? Check out some top picks of suburbs you should keep an eye on across the capital cities of Brisbane, Sydney, and Melbourne.
Advertisement
Buying a home or looking to refinance? The table below features home loans with some of the lowest interest rates on the market for owner occupiers.
| Lender | Home Loan | Interest Rate | Comparison Rate* | Monthly Repayment | Repayment type | Rate Type | Offset | Redraw | Ongoing Fees | Upfront Fees | Max LVR | Lump Sum Repayment | Extra Repayments | Split Loan Option | Tags | Features | Link | Compare | Promoted Product | Disclosure |
|---|---|---|---|---|---|---|---|---|---|---|---|---|---|---|---|---|---|---|---|---|
5.54% p.a. | 5.58% p.a. | $2,852 | Principal & Interest | Variable | $0 | $530 | 90% |
| Promoted | Disclosure | ||||||||||
5.49% p.a. | 5.40% p.a. | $2,836 | Principal & Interest | Variable | $0 | $0 | 80% |
| Promoted | Disclosure | ||||||||||
5.64% p.a. | 5.89% p.a. | $2,883 | Principal & Interest | Variable | $250 | $250 | 60% |
| Promoted | Disclosure | ||||||||||
5.64% p.a. | 5.89% p.a. | $2,883 | Principal & Interest | Variable | $248 | $350 | 60% |
| Disclosure |
Image by Kane Taylor via Unsplash

Ready, Set, Buy!
Learn everything you need to know about buying property – from choosing the right property and home loan, to the purchasing process, tips to save money and more!
With bonus Q&A sheet and Crossword!


 Rachel Horan
 Denise Raward


