The RBA's cash rate has hit 1.35%, which means banks are passing that onto to variable mortgages - existing and new.
Major banks have already announced they'll be passing on the 50 basis point rate rise in full, all the while home loan debt continues to grow at elevated levels, hovering near all time highs.
The average loan size for owner occupiers is $615,000 as of May, while the average new variable mortgage rate for owner occupiers for May is back to October 2021 levels at 2.61% p.a.
This is before the RBA's two Maxibon-sized 50 basis point increases in June and July.
RBA modelling suggests 200 basis points' increase to the cash rate could sink home prices by 15%. Economists have largely predicted home price falls of anywhere from 10 to 15%.
Since May the cash rate is only 75 basis points away from that marker; if it continues hiking in 2022, it's likely to hit 2.10% or higher by Christmas.
CMC Markets analyst Azeem Sheriff pencilled in four 25 basis point hikes for the rest of the year - this is not out of line with what other economists suggest.
"Once we get a better picture of the July 22 CPI [inflation] print, we will be able to reassess the situation ... jump in, strap on your seatbelts and get ready for a bumpy ride," Mr Sheriff said.
Inflation data for the June quarter will be released 27 July.
A class struggle: existing vs new vs recent homebuyers
Already CoreLogic is reporting soft auction numbers and clearance rates, and declining home prices in Sydney and Melbourne, which make up approximately two-thirds of the value of Australia's $10 trillion housing stock.
However, the mortgage pain will continue - Moody's research shows with a cash rate of 1.35%, dwelling prices would need to decline 14.2% to see an improvement in the affordability of mortgage payments.
This is at the upper-end of what many economists predict.
If the cash rate rises to 2.35% - realistic by late this year or early next - prices would need to decline 22.1% to see an improvement in mortgage affordability. Probably not gonna happen, lest the government continue to pump "affordability" programs.
The above modelling doesn't account for recent homebuyers who could find themselves in a negative equity situation with a rising mortgage rate to boot.
These are the people who bought at the top of the housing boom, spent all their cash on a deposit, who may have stretched their income-multiples and who may have been assessed on a serviceability rate lower than their mortgage rate in two years' time.
Homebuyers who bought two to three or more years ago are probably going to be fine; they're 21 months ahead on their mortgage payments according to RBA modelling, 200 basis points' increases would see that buffer lower to 19 months. Pre-pandemic it was 10 months.
They also squirrelled away $250 billion in deposits during the pandemic, and their homes increased in value at the fastest pace on record.
A damsel in this dress
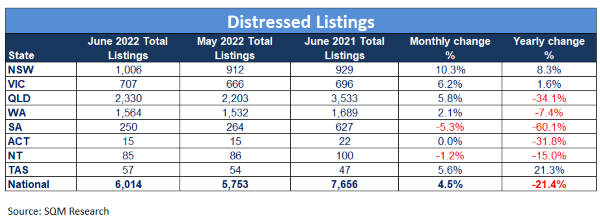
SQM Research data to 29 June shows there were 6,014 properties nationwide selling under distressed conditions.
This is up from 5,753 on 31 May, and from 5,500 on 5 April.
This is down on pre-pandemic levels, which SQM managing director Louis Christopher said is due to massive amounts of stimulus provided through Covid - but this support is waning.
"Going forward, with ongoing rises in interest rates and the end of the Covid relief period within the banking sector, I expect to see distressed listings activity return to levels recorded prior to Covid," Mr Christopher said.
"So, while it’s likely we will keep reporting rises over the next few months, it is not something I would be overly concerned about unless numbers rise well above 15,000 properties. Nevertheless, it is a noteworthy statistic.
"Queensland has the highest number of distressed listings, however we note this is not something new or something to be particularly concerned about as ever since we have been tracking distressed listings, Queensland, particularly Southeast Queensland has always had higher counts compared to other regions around the country."
SQM data also suggests Sydney housing asking prices have declined 15.2% compared to last week; that figure was 2.9% in Melbourne, and 2.2% in Brisbane.
Advertisement
Buying a home or looking to refinance? The table below features home loans with some of the lowest interest rates on the market for owner occupiers.
| Lender | Home Loan | Interest Rate | Comparison Rate* | Monthly Repayment | Repayment type | Rate Type | Offset | Redraw | Ongoing Fees | Upfront Fees | Max LVR | Lump Sum Repayment | Extra Repayments | Split Loan Option | Tags | Features | Link | Compare | Promoted Product | Disclosure |
|---|---|---|---|---|---|---|---|---|---|---|---|---|---|---|---|---|---|---|---|---|
5.54% p.a. | 5.58% p.a. | $2,852 | Principal & Interest | Variable | $0 | $530 | 90% |
| Promoted | Disclosure | ||||||||||
5.49% p.a. | 5.40% p.a. | $2,836 | Principal & Interest | Variable | $0 | $0 | 80% |
| Promoted | Disclosure | ||||||||||
5.64% p.a. | 5.89% p.a. | $2,883 | Principal & Interest | Variable | $250 | $250 | 60% |
| Promoted | Disclosure | ||||||||||
5.64% p.a. | 5.89% p.a. | $2,883 | Principal & Interest | Variable | $248 | $350 | 60% |
| Disclosure |


")

Photo by Peggy and Marco Lachmann-Anke on Pixabay

Ready, Set, Buy!
Learn everything you need to know about buying property – from choosing the right property and home loan, to the purchasing process, tips to save money and more!
With bonus Q&A sheet and Crossword!
.jpg)

 Denise Raward
 Harry O'Sullivan


 Rachel Horan